常规的各种 exporter 都是和需要监控的机器一起安装的,如果需要监控一些 tcp 端口和七层应用层的状态呢,这个时候就需要黑盒监控了,不需要安装在目标机器上即可从外部去监控。
9115 是它的 http 默认监听端口,blackbox.yml 它的配置文件里以基础的 http、dns、tcp、icmp 等 prober 定制配置出各种监测模块(module),在 prometheus server 的配置文件里声明用哪个模块去探测哪个 targets,下面以 docker-compose 启动一组实例,docker 的网络自带 dns,所以里面全部用名字替代 ip
1
2
3
4
5
6
7
8
9
10
11
12
13
14
15
16
17
18
19
20
21
22
23
24
25
26
27
28
29
30
31
32
33
34
35
36
37
38
39
40
41
42
43
44
45
46
47
48
49
50
51
52
53
54
55
56
57
58
59
60
61
62
63
64
65
66
67
68
69
70
71
72
73
74
75
76
77
78
79
80
81
82
83
84
85
86
87
88
89
90
91
92
93
94
95
96
97
version: '3.4' services: prometheus: image: prom/prometheus:v2.15.1 hostname: prometheus volumes: - /usr/share/zoneinfo/Asia/Shanghai:/etc/localtime:ro - ./prometheus.yml:/etc/prometheus/prometheus.yml - ./alert.rules:/etc/prometheus/alert.rules - prometheus_data:/prometheus command: - '--web.enable-lifecycle' - '--config.file=/etc/prometheus/prometheus.yml' ports: - '9090:9090' networks: prometheus: aliases: - prometheus logging: driver: json-file options: max-file: '3' max-size: 100m node-exporter: image: prom/node-exporter:v0.18.1 hostname: node-exporter volumes: - /usr/share/zoneinfo/Asia/Shanghai:/etc/localtime:ro - /proc:/host/proc:ro - /sys:/host/sys:ro - /:/host/rootfs:ro command: - '--path.procfs=/host/proc' - '--path.sysfs=/host/sys' ports: - '9100:9100' networks: prometheus: aliases: - exporter logging: driver: json-file options: max-file: '3' max-size: 100m black-exporter: image: prom/blackbox-exporter:v0.16.0 hostname: black-exporter volumes: - /usr/share/zoneinfo/Asia/Shanghai:/etc/localtime:ro - ./blackbox.yml:/config/blackbox.yml command: - '--config.file=/config/blackbox.yml' ports: - '9115:9115' networks: prometheus: aliases: - black-exporter logging: driver: json-file options: max-file: '3' max-size: 100m grafana: image: grafana/grafana:6.5.2 hostname: grafana volumes: - /usr/share/zoneinfo/Asia/Shanghai:/etc/localtime:ro - grafana_data:/var/lib/grafana environment: - GF_SECURITY_ADMIN_PASSWORD=pass depends_on: - prometheus ports: - '3000:3000' networks: prometheus: aliases: - grafana logging: driver: json-file options: max-file: '3' max-size: 100m networks: prometheus: driver: bridge volumes: grafana_data: {} prometheus_data: {}
prometheus.yml
1
2
3
4
5
6
7
8
9
10
11
12
13
14
15
16
17
18
19
20
21
22
23
24
25
26
27
global: scrape_interval: 5s external_labels: monitor: 'my-monitor' scrape_configs: - job_name: 'prometheus' static_configs: - targets: ['prometheus:9090' ] - job_name: 'balck_box' scrape_interval: 10s static_configs: - targets: ['black-exporter:9115' ] - job_name: 'balck_test' metrics_path: /probe params: module: [tcp_connect ] static_configs: - targets: - 120.52 .137 .xxx:81 - xxxxxx:123 relabel_configs: - source_labels: [__address__ ] target_label: __param_target - source_labels: [__param_target ] target_label: instance - target_label: __address__ replacement: black-exporter:9115
balckbox.yml
1
2
3
4
5
6
7
8
9
10
11
12
13
14
15
16
17
18
19
20
21
22
23
24
25
26
27
28
29
30
31
32
33
34
35
36
37
38
39
40
41
42
43
44
45
46
47
48
49
50
51
52
53
54
55
56
57
58
59
60
61
62
63
64
65
66
67
68
69
70
71
72
73
74
75
76
77
78
79
80
81
82
83
84
85
86
87
88
89
90
91
92
93
94
95
96
97
98
99
100
101
102
103
104
105
106
107
108
109
110
111
112
113
114
115
116
117
118
119
120
121
122
123
124
125
126
127
128
129
130
modules: http_2xx_example: prober: http timeout: 5s http: valid_http_versions: ["HTTP/1.1" , "HTTP/2" ] valid_status_codes: [] method: GET headers: Host: vhost.example.com Accept-Language: en-US no_follow_redirects: false fail_if_ssl: false fail_if_not_ssl: false fail_if_matches_regexp: - "Could not connect to database" fail_if_not_matches_regexp: - "Download the latest version here" tls_config: insecure_skip_verify: false preferred_ip_protocol: "ip4" ip_protocol_fallback: false http_post_2xx: prober: http timeout: 5s http: method: POST headers: Content-Type: application/json body: '{}' http_basic_auth_example: prober: http timeout: 5s http: method: POST headers: Host: "login.example.com" basic_auth: username: "username" password: "mysecret" http_custom_ca_example: prober: http http: method: GET tls_config: ca_file: "/certs/my_cert.crt" tls_connect_tls: prober: tcp timeout: 5s tcp: tls: true tcp_connect: prober: tcp timeout: 5s imap_starttls: prober: tcp timeout: 5s tcp: query_response: - expect: "OK.*STARTTLS" - send: ". STARTTLS" - expect: "OK" - starttls: true - send: ". capability" - expect: "CAPABILITY IMAP4rev1" smtp_starttls: prober: tcp timeout: 5s tcp: query_response: - expect: "^220 ([^ ]+) ESMTP (.+)$" - send: "EHLO prober" - expect: "^250-STARTTLS" - send: "STARTTLS" - expect: "^220" - starttls: true - send: "EHLO prober" - expect: "^250-AUTH" - send: "QUIT" ssh_banner: prober: tcp tcp: query_response: - expect: "^SSH-" irc_banner_example: prober: tcp timeout: 5s tcp: query_response: - send: "NICK prober" - send: "USER prober prober prober :prober" - expect: "PING :([^ ]+)" send: "PONG ${1}" - expect: "^:[^ ]+ 001" icmp_example: prober: icmp timeout: 5s icmp: preferred_ip_protocol: "ip4" source_ip_address: "127.0.0.1" dns_udp_example: prober: dns timeout: 5s dns: query_name: "www.prometheus.io" query_type: "A" valid_rcodes: - NOERROR validate_answer_rrs: fail_if_matches_regexp: - ".*127.0.0.1" fail_if_not_matches_regexp: - "www.prometheus.io.\t300\tIN\tA\t127.0.0.1" validate_authority_rrs: fail_if_matches_regexp: - ".*127.0.0.1" validate_additional_rrs: fail_if_matches_regexp: - ".*127.0.0.1" dns_soa: prober: dns dns: query_name: "prometheus.io" query_type: "SOA" dns_tcp_example: prober: dns dns: transport_protocol: "tcp" preferred_ip_protocol: "ip4" query_name: "www.prometheus.io"
上面的探针定义参考官方的 demo,其中在 prometheus 的配置文件里探测那部分是最终版本,如果要简单的探测可以先下面这样写
1
2
3
4
5
6
7
8
9
- job_name: 'balck_test' metrics_path: /probe params: module: [tcp_connect ] target: - 120.52 .137 .xxx:81 - xxxx:44 static_configs: - targets: ['black-exporter:9115' ]
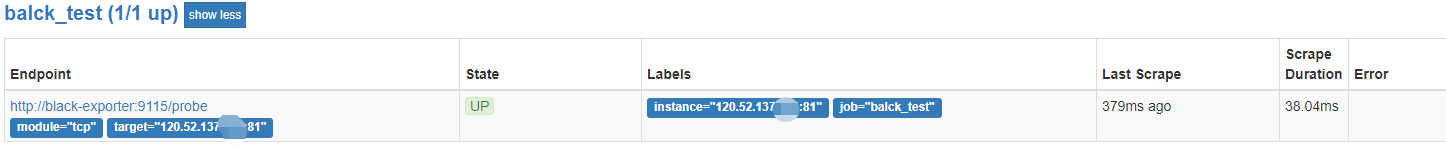
params 声明的参数将会是发送到黑盒的 http 接口当作参数,向 black-exporter:9115 的 web 路由 /probe 发送参数包含 module 和探测的target.curl 模拟 http(prometheus 拉取 metrics 也是发同样的 http 请求)请求能看到 metrics 信息输出,下面是一个curl获取黑盒监控使用 icmp 模块去检测 192.168.1.2 返回的 metrics 的例子
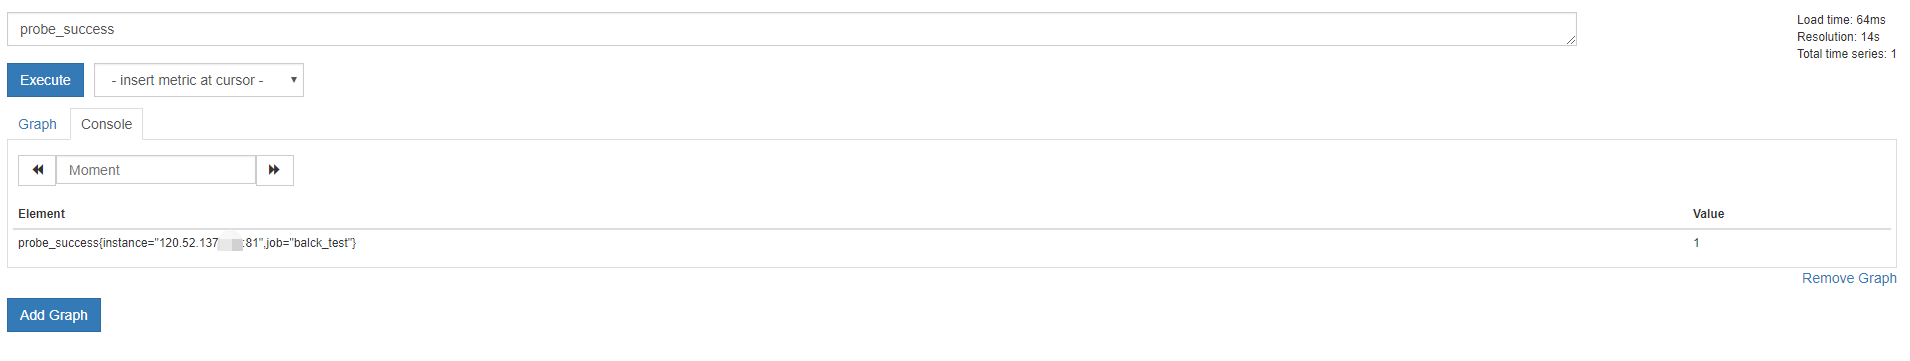
1
2
3
4
5
6
7
8
9
10
11
12
13
$ curl "http://127.0.0.1:9115/probe?module=ping&target=192.168.1.2" # HELP probe_dns_lookup_time_seconds Returns the time taken for probe dns lookup in seconds # TYPE probe_dns_lookup_time_seconds gauge probe_dns_lookup_time_seconds 2.6453e-05 # HELP probe_duration_seconds Returns how long the probe took to complete in seconds # TYPE probe_duration_seconds gauge probe_duration_seconds 0.000351649 # HELP probe_ip_protocol Specifies whether probe ip protocol is IP4 or IP6 # TYPE probe_ip_protocol gauge probe_ip_protocol 4 # HELP probe_success Displays whether or not the probe was a success # TYPE probe_success gauge probe_success 1
我提供的文件里涉及到 relabel,向 target 发送请求,但是因为直接 relabel 替换最终会向黑盒探测的端口发送,这是常见的两种写法。但是如果不用 relabel 下,我们想给 target 加一些 label 呢,而params 不支持添加 labels,所以我们得利用 prometheus 的 relabel 实现,也就是我提供的文件里这部分
1
2
3
4
5
6
7
8
9
10
11
12
13
14
15
- job_name: 'balck_test' metrics_path: /probe params: module: [tcp_connect ] static_configs: - targets: - 120.52 .137 .xxx:81 - xxxxxx:123 relabel_configs: - source_labels: [__address__ ] target_label: __param_target - source_labels: [__param_target ] target_label: instance - target_label: __address__ replacement: black-exporter:9115
第一步获取 targets 的实例address值写进__param_target, __param_<name>形式的标签里的 name 和它的值会被添加到发送到黑盒的 http 的 header 的 params 当作键值,例如__param_module 对应 params 里的 module
第2步,获取 __param_target 的值,并覆写到 instance 标签中
第3步,覆写 Target 实例的 __address__ 标签值为 BlockBox Exporter 实例的访问地址
第4部,向black-exporter:9115 发送请求获取实例的 metrics 信息
另外我们这边直接监控 suse 发现内核 hang 死了四层 tcp 还是可达的,ssh 的话和 telnet 都会回应 openssh 的字样,所以ssh_banner模块检测是认定为存活的,决定监控应用层。询问同事故障的现象是他用 sap 的客户端登陆报错,然后我上去 tcpdump 抓包导入 wireshark 把他登陆的 http 请求头写成了模块,后面内核 hang 死完全及时告警
1
2
3
4
5
6
7
8
9
10
11
12
13
14
15
16
http_post_sap: prober: http timeout: 3s http: method: POST headers: POST: '/SAPControl HTTP/1.1' Accept: 'text/xml, text/html, image/gif, image/jpeg, *; q=.2, */*; q=.2' Content-Type: 'text/xml; charset=utf-8' Cache-Control: 'no-cache' Pragma: 'no-cache' User-Agent: 'Java/1.8.0_172' Connection: 'keep-alive' Content-Length: '200' body: | <SOAP-ENV:Envelope xmlns:SOAP-ENV="http://schemas.xmlsoap.org/soap/envelope/" xmlns:q0="urn:SAPControl"><SOAP-ENV:Header/><SOAP-ENV:Body><q0:GetInstanceProperties/></SOAP-ENV:Body></SOAP-ENV:Envelope>
1
2
3
4
5
6
7
8
9
10
11
12
13
14
15
16
17
- job_name: 'hana_up' scrape_interval: 4s metrics_path: /probe params: module: ['http_post_sap' ] static_configs: - targets: - "http://10.20.4.14:50013/SAPControl" - "http://10.20.4.4:50013/SAPControl" - "http://10.20.4.9:50013/SAPControl" relabel_configs: - source_labels: [__address__ ] target_label: __param_target - source_labels: [__param_target ] target_label: instance - target_label: __address__ replacement: black-exporter:9115
SSL 证书过期时间监控
1
2
3
4
5
6
modules: http_2xx: prober: http timeout: 10s http: preferred_ip_protocol: "ip4"
1
2
3
4
5
6
7
8
9
10
11
12
13
14
15
scrape_configs: - job_name: 'blackbox' metrics_path: /probe params: module: [http_2xx ] static_configs: - targets: - example.com relabel_configs: - source_labels: [__address__ ] target_label: __param_target - source_labels: [__param_target ] target_label: instance - target_label: __address__ replacement: black-exporter:9115
告警规则
1
2
3
4
5
6
groups: - name: ssl_expiry.rules rules: - alert: SSLCertExpiringSoon expr: probe_ssl_earliest_cert_expiry{job="blackbox"} - time() < 86400 * 30 for: 20m