先说明一点,时区UTC不影响prometheus和grafana,这篇文章只是提供一个修改的思路和步骤
日志时区修改 代码分析 先起最新的prometheus挂载时区文件
1
2
3
4
5
6
7
docker run --net host -v /etc/localtime:/etc/localtime prom/prometheus level=info ts=2019-09-05T09:44:40.409Z caller=main.go:293 msg="no time or size retention was set so using the default time retention" duration=15d level=info ts=2019-09-05T09:44:40.409Z caller=main.go:329 msg="Starting Prometheus" version="(version=2.12.0, branch=HEAD, revision=43acd0e2e93f9f70c49b2267efa0124f1e759e86)" level=info ts=2019-09-05T09:44:40.409Z caller=main.go:330 build_context="(go=go1.12.8, user=root@7a9dbdbe0cc7, date=20190818-13:53:16)" level=info ts=2019-09-05T09:44:40.409Z caller=main.go:331 host_details="(Linux 3.10.0-957.el7.x86_64 #1 SMP Thu Nov 8 23:39:32 UTC 2018 x86_64 centos7 (none))" level=info ts=2019-09-05T09:44:40.409Z caller=main.go:332 fd_limits="(soft=1048576, hard=1048576)" level=info ts=2019-09-05T09:44:40.409Z caller=main.go:333 vm_limits="(soft=unlimited, hard=unlimited)"
发现logFormat还是UTC时区,去官方github上https://github.com/prometheus/prometheus/blob/master/cmd/prometheus/main.go查找,按照关键字Starting Prometheus找到下面
1 level.Info(logger).Log("msg", "Starting Prometheus", "version", version.Info())
然后查找logger
1 logger := promlog.New(&cfg.promlogConfig)
promlog是官方另一个仓库下的包
1 "github.com/prometheus/common/promlog"
包里我们可以看到默认使用utc时区
1
2
3
4
5
6
7
8
9
10
11
12
13
14
15
16
var ( // This timestamp format differs from RFC3339Nano by using .000 instead // of .999999999 which changes the timestamp from 9 variable to 3 fixed // decimals (.130 instead of .130987456). timestampFormat = log.TimestampFormat( func() time.Time { return time.Now().UTC() }, "2006-01-02T15:04:05.000Z07:00", ) ) ... func New(config *Config) log.Logger { var l log.Logger ... l = log.With(l, "ts", timestampFormat, "caller", log.DefaultCaller) return l }
默认使用timestampFormat,log.With方法可以外部使用,但是分析里面逻辑是append
1
2
3
4
5
type context struct { logger Logger keyvals []interface{} hasValuer bool }
我们无法通过下面类似的再赋值的方法设置logger
1
2
3
4
5
6
timestampFormat = log.TimestampFormat( func() time.Time { return time.Now().Local() }, "2006-01-02T15:04:05.000Z07:00", ) ... logger = log.With(logger, "ts", timestampFormat, "caller", log.DefaultCaller)
可以跳转到包函数里看到log.With的深层调用类似于context.WithValue一样,并且没有delete方法,修改官方的包也不现实。为此只能在New的时候设置好,先看promlog.New方法,在文件github.com/prometheus/common/promlog/log.go里
1
2
3
4
5
6
7
8
9
10
11
12
func New(config *Config) log.Logger { var l log.Logger if config.Format.s == "logfmt" { l = log.NewLogfmtLogger(log.NewSyncWriter(os.Stderr)) } else { l = log.NewJSONLogger(log.NewSyncWriter(os.Stderr)) } l = level.NewFilter(l, config.Level.o) l = log.With(l, "ts", log.DefaultTimestampUTC, "caller", log.DefaultCaller) return l }
里面的config.Format.s的s字段无法外部引用,同理config.Level.o,因为我们是取值做比较,config.Format实现有一个获取s的方法
1
2
3
func (f *AllowedFormat) String() string { return f.s }
所以if config.Format.s == "logfmt"可以写成下面
1 if config.Format.String() == "logfmt" {
同理config.Level.o借助config.Level.String()获取config.Level.s,然后方法config.Level.Set()里的逻辑去case s间接获取config.Level.o
下面是最终的代码,替换掉logger := promlog.New(&cfg.promlogConfig)。官方说UTC防止夏令时误差,另外也怕乱写flag干扰了官方自己的flag解析逻辑,这里用环境变量来当作开关
1
2
3
4
5
6
7
8
9
10
11
12
13
14
15
16
17
18
19
20
21
22
23
24
25
26
27
28
29
30
31
32
33
34
35
36
37
38
39
[root@centos7 prometheus]# cp cmd/prometheus/main.go{,.bak} [root@centos7 prometheus]# diff cmd/prometheus/main.go* 261,293c261 < var logger log.Logger < if os.Getenv("LocalTZ") != "" { < logger = func(config *promlog.Config) log.Logger { < var ( < l log.Logger < le level.Option < ) < if config.Format.String() == "logfmt" { < l = log.NewLogfmtLogger(log.NewSyncWriter(os.Stderr)) < } else { < l = log.NewJSONLogger(log.NewSyncWriter(os.Stderr)) < } < < switch config.Level.String() { < case "debug": < le = level.AllowDebug() < case "info": < le = level.AllowInfo() < case "warn": < le = level.AllowWarn() < case "error": < le = level.AllowError() < } < l = level.NewFilter(l, le) < l = log.With(l, "ts", log.TimestampFormat( < func() time.Time { return time.Now().Local() }, < "2006-01-02T15:04:05.000Z07:00", < ), "caller", log.DefaultCaller) < return l < }(&cfg.promlogConfig) < } else { < logger = promlog.New(&cfg.promlogConfig) < } --- > logger := promlog.New(&cfg.promlogConfig)
编译 这里我是在centos7上编译的,makefile有点复杂看不明白,这里仅仅提供一个思路
1
2
3
GO111MODULE=on GOPROXY=https://goproxy.cn,https://mirrors.aliyun.com/goproxy/,https://goproxy.io,https://athens.azurefd.net,direct GOPATH=/root/go/
下载代码,根据开发规范,master代码包含最新提交的代码,我们得修改release的,所以得去tag看下版本,当前是v2.14.0版本
1 git clone https://github.com/prometheus/prometheus.git -b v2.14.0 $GOPATH/src/prometheus
修改后加入变量和设置logger的部分后编译
1
2
3
4
5
cd $GOPATH /src/prometheusCGO_ENABLED=0 go build ./cmd/prometheus CGO_ENABLED=0 go build ./cmd/promtool
喜欢二进制的朋友后面这步的docker可以不用看了
构建docker镜像 修改Dockerfile,dockerfile前两行架构根据自己编译环境修改
1
2
ARG ARCH="amd64" ARG OS="linux"
最终修改的地方为下面
1
2
3
4
5
6
7
8
9
10
11
12
13
14
15
[root@centos7 prometheus]# cp Dockerfile{,.bak} [root@centos7 prometheus]# vi Dockerfile [root@centos7 prometheus]# diff Dockerfil* 3,4c3,4 < FROM quay.azk8s.cn/prometheus/busybox-${OS}-${ARCH}:latest < LABEL maintainer="zhangguanzhang@qq.com" --- > FROM quay.io/prometheus/busybox-${OS}-${ARCH}:latest > LABEL maintainer="The Prometheus Authors <prometheus-developers@googlegroups.com>" 8,9c8,9 < COPY prometheus /bin/prometheus < COPY promtool /bin/promtool --- > COPY .build/${OS}-${ARCH}/prometheus /bin/prometheus > COPY .build/${OS}-${ARCH}/promtool /bin/promtool
构建docker镜像
1
2
3
4
5
6
7
8
9
10
11
12
13
14
15
16
17
18
19
20
21
22
23
24
25
26
27
28
29
30
31
32
33
34
35
36
37
38
39
40
41
42
43
44
45
46
47
48
49
50
51
52
53
54
55
56
57
58
59
[root@centos7 prometheus]# docker build -t zhangguanzhang/prometheus-local-tz . Sending build context to Docker daemon 293.7MB Step 1/19 : ARG ARCH="amd64" Step 2/19 : ARG OS="linux" Step 3/19 : FROM quay.azk8s.cn/prometheus/busybox-${OS}-${ARCH}:latest ---> a130381627cc Step 4/19 : LABEL maintainer="zhangguanzhang@qq.com" ---> Using cache ---> a068e6a45287 Step 5/19 : ARG ARCH="amd64" ---> Using cache ---> 6505ef521adc Step 6/19 : ARG OS="linux" ---> Using cache ---> 095340c78781 Step 7/19 : COPY prometheus /bin/prometheus ---> 79b168131d07 Step 8/19 : COPY promtool /bin/promtool ---> 3e33c1426f1a Step 9/19 : COPY documentation/examples/prometheus.yml /etc/prometheus/prometheus.yml ---> 3c52a921a987 Step 10/19 : COPY console_libraries/ /usr/share/prometheus/console_libraries/ ---> 2a45779cac8c Step 11/19 : COPY consoles/ /usr/share/prometheus/consoles/ ---> 61bcb1331d2d Step 12/19 : RUN ln -s /usr/share/prometheus/console_libraries /usr/share/prometheus/consoles/ /etc/prometheus/ ---> Running in 903bd335e5ce Removing intermediate container 903bd335e5ce ---> 9271991e65b8 Step 13/19 : RUN mkdir -p /prometheus && chown -R nobody:nogroup etc/prometheus /prometheus ---> Running in 198813fcbeda Removing intermediate container 198813fcbeda ---> eab302d879ec Step 14/19 : USER nobody ---> Running in 7ab7eb05eafa Removing intermediate container 7ab7eb05eafa ---> addfdf87059b Step 15/19 : EXPOSE 9090 ---> Running in 5878d52b1b35 Removing intermediate container 5878d52b1b35 ---> 55b458345a79 Step 16/19 : VOLUME [ "/prometheus" ] ---> Running in cc052e89a0fd Removing intermediate container cc052e89a0fd ---> bc33a7a6a10d Step 17/19 : WORKDIR /prometheus ---> Running in 6ed7db542fae Removing intermediate container 6ed7db542fae ---> 362ed0911712 Step 18/19 : ENTRYPOINT [ "/bin/prometheus" ] ---> Running in 76c4815fac4b Removing intermediate container 76c4815fac4b ---> 56546f3b3e5c Step 19/19 : CMD [ "--config.file=/etc/prometheus/prometheus.yml", "--storage.tsdb.path=/prometheus", "--web.console.libraries=/usr/share/prometheus/console_libraries", "--web.console.templates=/usr/share/prometheus/consoles" ] ---> Running in ebbdbce5813c Removing intermediate container ebbdbce5813c ---> a601e70e97b7 Successfully built a601e70e97b7 Successfully tagged zhangguanzhang/prometheus-local-tz:latest
运行测试 1 2 3 4 5 6 7 8 9 10 11 12 13 14 15 16 17 18 19 20 21 22 23 24 25 26 27 28 29 30 31 32 33 34 35 36 37 38 39 40 41 42 43 44 45 46 47 48 49 50 51 52 53 54 55 56 57 58 [root@centos7 prometheus]# docker run --rm --net host -v /etc/localtime:/etc/localtime zhangguanzhang/prometheus-local-tz level=info ts=2019-09-05T14:07:58.359Z caller=main.go:328 msg="no time or size retention was set so using the default time retention" duration=15d level=info ts=2019-09-05T14:07:58.359Z caller=main.go:364 msg="Starting Prometheus" version="(version=, branch=, revision=)" level=info ts=2019-09-05T14:07:58.359Z caller=main.go:365 build_context="(go=go1.13, user=, date=)" level=info ts=2019-09-05T14:07:58.359Z caller=main.go:366 host_details="(Linux 3.10.0-957.el7.x86_64 #1 SMP Thu Nov 8 23:39:32 UTC 2018 x86_64 centos7 (none))" level=info ts=2019-09-05T14:07:58.359Z caller=main.go:367 fd_limits="(soft=1048576, hard=1048576)" level=info ts=2019-09-05T14:07:58.359Z caller=main.go:368 vm_limits="(soft=unlimited, hard=unlimited)" level=info ts=2019-09-05T14:07:58.361Z caller=main.go:689 msg="Starting TSDB ..." level=info ts=2019-09-05T14:07:58.361Z caller=web.go:450 component=web msg="Start listening for connections" address=0.0.0.0:9090 level=info ts=2019-09-05T14:07:58.390Z caller=head.go:509 component=tsdb msg="replaying WAL, this may take awhile" level=info ts=2019-09-05T14:07:58.391Z caller=head.go:557 component=tsdb msg="WAL segment loaded" segment=0 maxSegment=0 level=info ts=2019-09-05T14:07:58.394Z caller=main.go:704 fs_type=XFS_SUPER_MAGIC level=info ts=2019-09-05T14:07:58.394Z caller=main.go:705 msg="TSDB started" level=info ts=2019-09-05T14:07:58.394Z caller=main.go:775 msg="Loading configuration file" filename=/etc/prometheus/prometheus.yml level=info ts=2019-09-05T14:07:58.904Z caller=main.go:803 msg="Completed loading of configuration file" filename=/etc/prometheus/prometheus.yml level=info ts=2019-09-05T14:07:58.904Z caller=main.go:658 msg="Server is ready to receive web requests." ^Clevel=warn ts=2019-09-05T14:07:59.097Z caller=main.go:533 msg="Received SIGTERM, exiting gracefully..." level=info ts=2019-09-05T14:07:59.098Z caller=main.go:558 msg="Stopping scrape discovery manager..." level=info ts=2019-09-05T14:07:59.098Z caller=main.go:572 msg="Stopping notify discovery manager..." level=info ts=2019-09-05T14:07:59.098Z caller=main.go:594 msg="Stopping scrape manager..." level=info ts=2019-09-05T14:07:59.098Z caller=manager.go:814 component="rule manager" msg="Stopping rule manager..." level=info ts=2019-09-05T14:07:59.098Z caller=manager.go:820 component="rule manager" msg="Rule manager stopped" level=info ts=2019-09-05T14:07:59.098Z caller=main.go:554 msg="Scrape discovery manager stopped" level=info ts=2019-09-05T14:07:59.098Z caller=main.go:568 msg="Notify discovery manager stopped" level=info ts=2019-09-05T14:07:59.098Z caller=main.go:588 msg="Scrape manager stopped" level=info ts=2019-09-05T14:07:59.098Z caller=notifier.go:602 component=notifier msg="Stopping notification manager..." level=info ts=2019-09-05T14:07:59.098Z caller=main.go:759 msg="Notifier manager stopped" level=info ts=2019-09-05T14:07:59.100Z caller=main.go:771 msg="See you next time!" [root@centos7 prometheus]# docker run --rm --net host -e LocalTZ=true -v /etc/localtime:/etc/localtime zhangguanzhang/prometheus-local-tz level=info ts=2019-09-05T22:08:03.597+08:00 caller=main.go:328 msg="no time or size retention was set so using the default time retention" duration=15d level=info ts=2019-09-05T22:08:03.598+08:00 caller=main.go:364 msg="Starting Prometheus" version="(version=, branch=, revision=)" level=info ts=2019-09-05T22:08:03.598+08:00 caller=main.go:365 build_context="(go=go1.13, user=, date=)" level=info ts=2019-09-05T22:08:03.598+08:00 caller=main.go:366 host_details="(Linux 3.10.0-957.el7.x86_64 #1 SMP Thu Nov 8 23:39:32 UTC 2018 x86_64 centos7 (none))" level=info ts=2019-09-05T22:08:03.598+08:00 caller=main.go:367 fd_limits="(soft=1048576, hard=1048576)" level=info ts=2019-09-05T22:08:03.598+08:00 caller=main.go:368 vm_limits="(soft=unlimited, hard=unlimited)" level=info ts=2019-09-05T22:08:03.602+08:00 caller=main.go:689 msg="Starting TSDB ..." level=info ts=2019-09-05T22:08:03.604+08:00 caller=web.go:450 component=web msg="Start listening for connections" address=0.0.0.0:9090 level=info ts=2019-09-05T22:08:03.614+08:00 caller=head.go:509 component=tsdb msg="replaying WAL, this may take awhile" level=info ts=2019-09-05T22:08:03.616+08:00 caller=head.go:557 component=tsdb msg="WAL segment loaded" segment=0 maxSegment=0 level=info ts=2019-09-05T22:08:03.618+08:00 caller=main.go:704 fs_type=XFS_SUPER_MAGIC level=info ts=2019-09-05T22:08:03.618+08:00 caller=main.go:705 msg="TSDB started" level=info ts=2019-09-05T22:08:03.618+08:00 caller=main.go:775 msg="Loading configuration file" filename=/etc/prometheus/prometheus.yml level=info ts=2019-09-05T22:08:04.125+08:00 caller=main.go:803 msg="Completed loading of configuration file" filename=/etc/prometheus/prometheus.yml level=info ts=2019-09-05T22:08:04.126+08:00 caller=main.go:658 msg="Server is ready to receive web requests." ^Clevel=warn ts=2019-09-05T22:08:04.269+08:00 caller=main.go:533 msg="Received SIGTERM, exiting gracefully..." level=info ts=2019-09-05T22:08:04.269+08:00 caller=main.go:558 msg="Stopping scrape discovery manager..." level=info ts=2019-09-05T22:08:04.269+08:00 caller=main.go:572 msg="Stopping notify discovery manager..." level=info ts=2019-09-05T22:08:04.269+08:00 caller=main.go:594 msg="Stopping scrape manager..." level=info ts=2019-09-05T22:08:04.269+08:00 caller=manager.go:814 component="rule manager" msg="Stopping rule manager..." level=info ts=2019-09-05T22:08:04.269+08:00 caller=manager.go:820 component="rule manager" msg="Rule manager stopped" level=info ts=2019-09-05T22:08:04.269+08:00 caller=notifier.go:602 component=notifier msg="Stopping notification manager..." level=info ts=2019-09-05T22:08:04.269+08:00 caller=main.go:759 msg="Notifier manager stopped" level=info ts=2019-09-05T22:08:04.269+08:00 caller=main.go:554 msg="Scrape discovery manager stopped" level=info ts=2019-09-05T22:08:04.269+08:00 caller=main.go:568 msg="Notify discovery manager stopped" level=info ts=2019-09-05T22:08:04.269+08:00 caller=main.go:588 msg="Scrape manager stopped" level=info ts=2019-09-05T22:08:04.269+08:00 caller=main.go:771 msg="See you next time!" [root@centos7 prometheus]# date Thu Sep 5 22:08:11 CST 2019
测试成功,哪位看懂了官方的makefile逻辑可以告诉下我,我修改下构建过程
web ui 修改 主要文件为web/ui/static/js/graph/index.js
1
2
var date = '<span class="date">' + new Date(x * 1000).toUTCString() + '</span>';
改为
1 var date = '<span class="date">' + new Date(x * 1000).toString() + '</span>';
1 return self.endDate.data('DateTimePicker').date();
改为
1 return self.endDate.data('DateTimePicker').getLocalDate().getTime();
最终差异为
1
2
3
4
5
6
7
8
[root@centos7 prometheus]# vi web/ui/static/js/graph/index.js [root@centos7 prometheus]# diff web/ui/static/js/graph/index.js <(curl -s https://raw.githubusercontent.com/prometheus/prometheus/master/web/ui/static/js/graph/index.js) 400c400 < return self.endDate.data('DateTimePicker').getLocalDate().getTime(); --- > return self.endDate.data('DateTimePicker').date(); 765d764 < var date = '<span class="date">' + new Date(x * 1000).toString() + '</span>';
编译 进入到项目目录
1
2
3
4
5
6
7
8
[root@centos7 prometheus]# make assets >> writing assets cd /root/go/src/prometheus/web/ui && GO111MODULE=on go generate -x -v -mod=vendor assets_vfsdata.go doc.go go run -mod=vendor -tags=dev assets_generate.go writing assets_vfsdata.go [root@centos7 prometheus]# CGO_ENABLED=0 go build ./cmd/prometheus
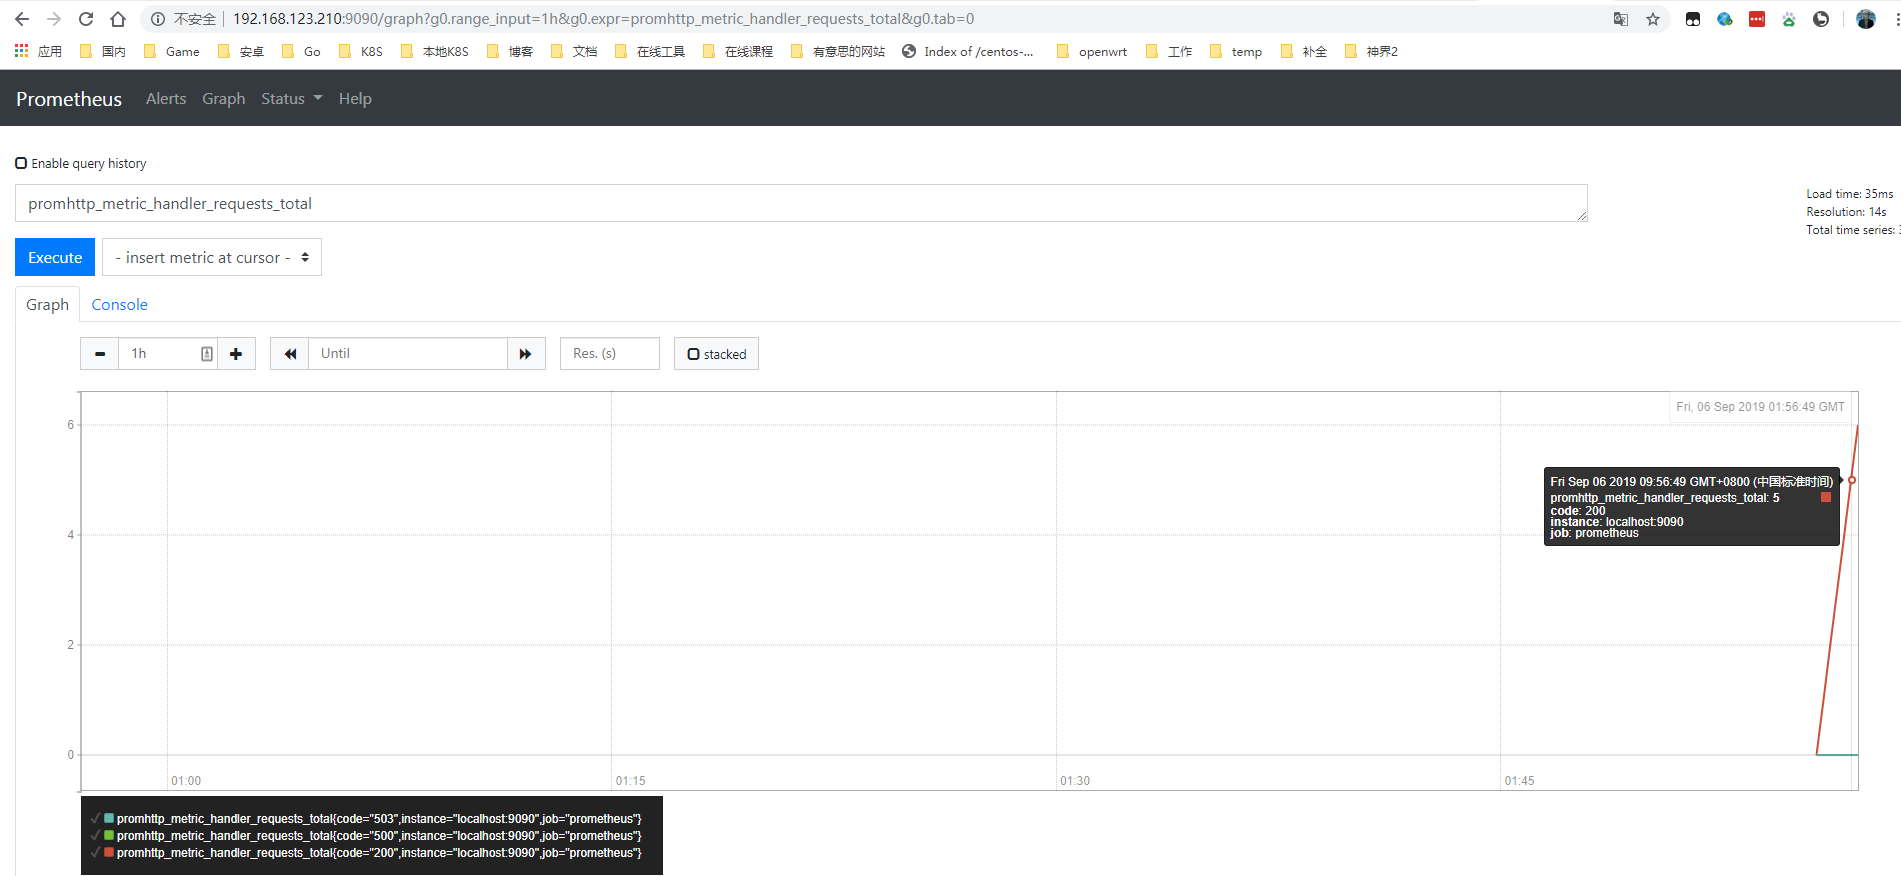
打包后运行查看